DataEQ, the team behind Good Outcomes, turns unstructured customer data into structured intelligence. They collect what customers are saying publicly, on social media, review platforms, and messaging channels, and process it through a combination of machine learning, generative AI, and human labelling. The result is reliable, labelled data that teams can actually act on. They have been doing this since 2007, with deep expertise in financial services.
Good Outcomes takes that foundation further. We apply a conduct intelligence lens to the same data, interpreting it not just for how customers feel, but for what it tells us about whether outcomes are actually being delivered, and where they are breaking down.
Each year DataEQ publishes industry-level sentiment indices that map how brands are performing through the lens of their customers. The UK Pet Insurance Sentiment Index 2026 captured 34,112 mentions across X and Trustpilot over twelve months, covering six brands: Agria, Napo, Waggel, Animal Friends, Petplan, and Purely Pets. It is one of the most detailed public datasets available on how UK pet insurance customers experience their insurers. Here is what we found when we read it through a conduct lens.
DataEQ reports three net sentiment metrics, and reading the index well means being clear which one you are looking at. Overall captures the full balance of customer conversation across online channels, the closest thing to an unvarnished picture of brand health. Operational isolates conversation from customers in the service journey, stripping out brand noise to give a cleaner signal on where service is working and where it is not. Reputational isolates brand-led conversation, driven by campaigns, PR, and public commentary, and tracks whether brand activity is building goodwill independent of operational performance.
Each tells a different story. Each matters for a different reason. This analysis moves between them where the data calls for it.
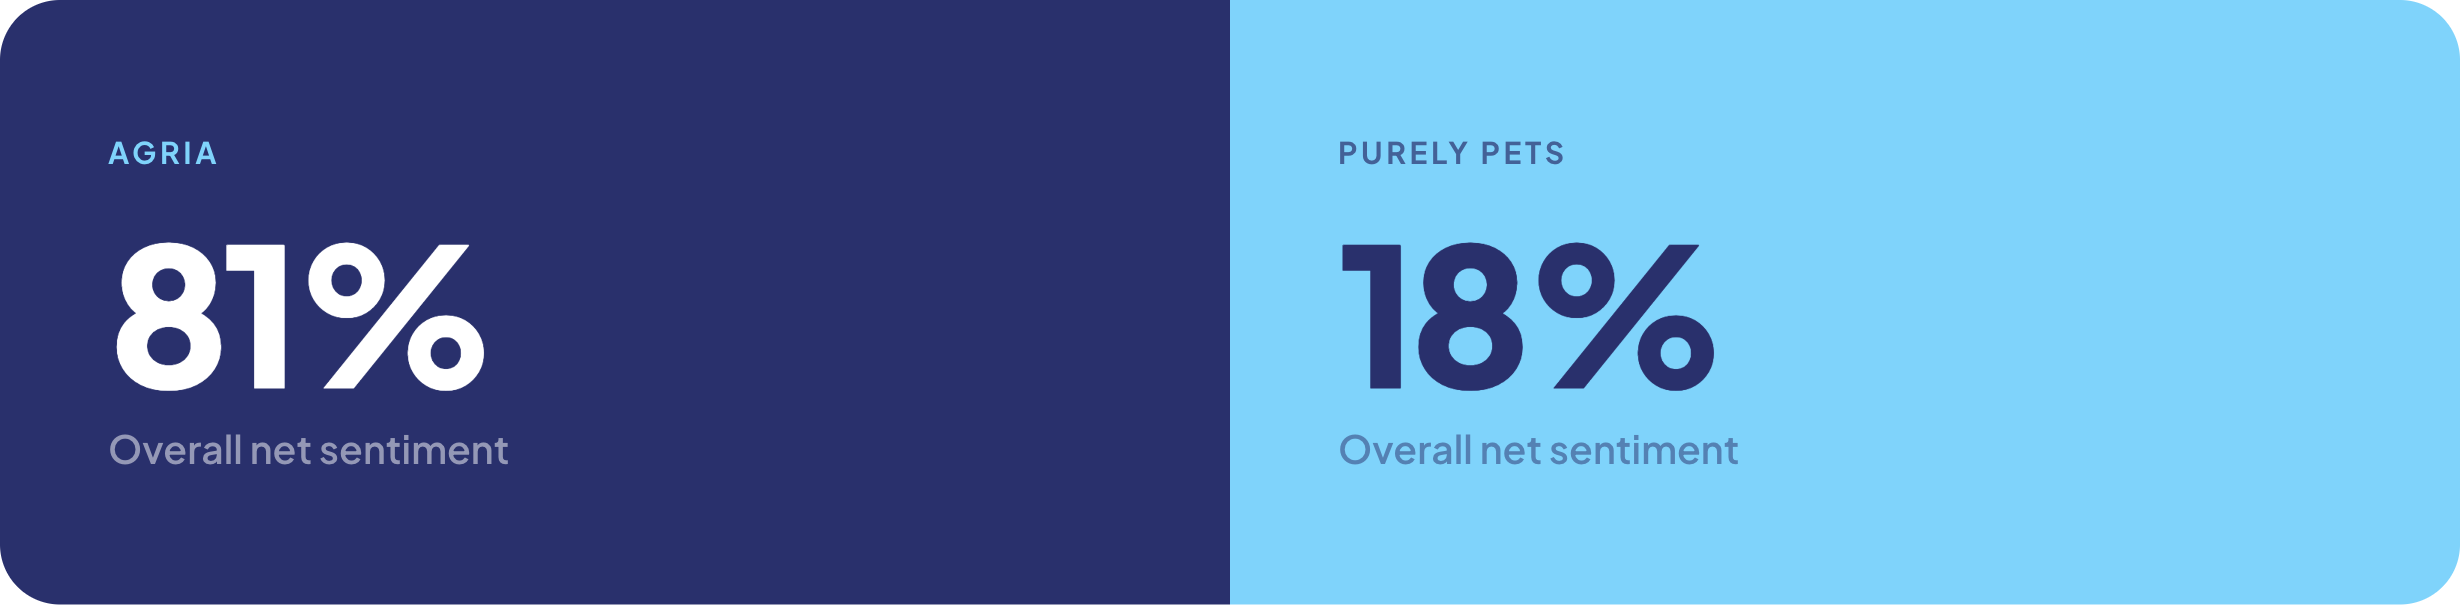
The headline figure is overall net sentiment, and it is stark. Agria sits at 81%. Purely Pets at 18%. A 63-point spread across six brands operating in the same market, under the same regulation, serving broadly the same customer base.
Operational net sentiment sharpens the picture. Strip out brand conversation and focus on how customers experience day-to-day service, and Agria leads at 87%, the highest in the index. Purely Pets sits at 19%. 68 points between the best and worst.
What separates them is not a mystery. The brands at the top, Agria, Napo, Waggel, are getting the fundamentals right. Resolving claims promptly. Communicating clearly. Treating customers with respect during the moments that matter. The brands at the bottom are not. The data shows it in how customers describe their experience, not just in how they score it.
Trustpilot is one of the most visible public sources of customer sentiment in UK insurance, and firms routinely point to it as evidence that outcomes are being delivered. But not all Trustpilot reviews carry the same weight.
The index separated Trustpilot into two categories. Invited reviews, prompted by the insurer after a transaction. Organic reviews, left by customers on their own initiative.
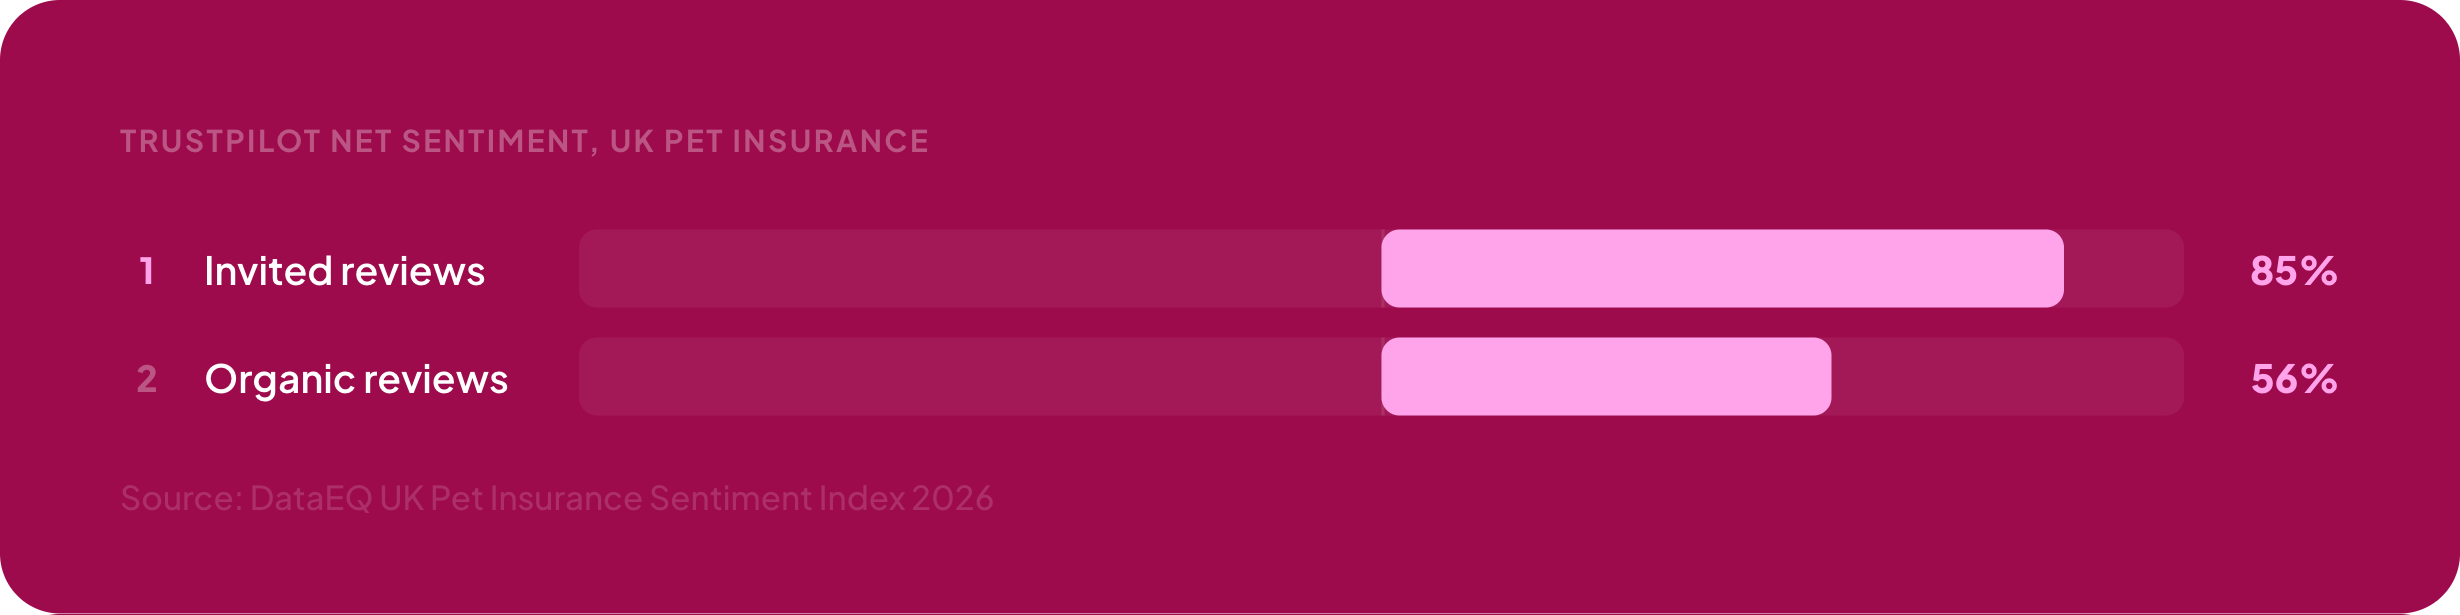
The bias runs in one direction. Invited reviews consistently overstate how positive the customer experience is. That is not gaming, and it is not manipulation. Most invitation programmes are well-intentioned, and customers who had a good interaction are more likely to respond to a prompt than customers who had a bad one. The asymmetry sits in the mechanics, not the intent.
For outcomes monitoring, the implication is direct. If a firm is relying on invited Trustpilot data to evidence good outcomes, the picture it is working from is structurally 29 points more positive than what customers describe when they choose to speak on their own terms. That is a direction of travel, not a rounding error. It makes weak outcomes look acceptable and acceptable outcomes look strong.
The organic layer is where the harder conduct signal sits. It is also the layer most firms are not monitoring systematically.
When you map these 34,112 mentions against the FCA's four Consumer Duty outcomes, one dominates the conversation and one is almost entirely absent.
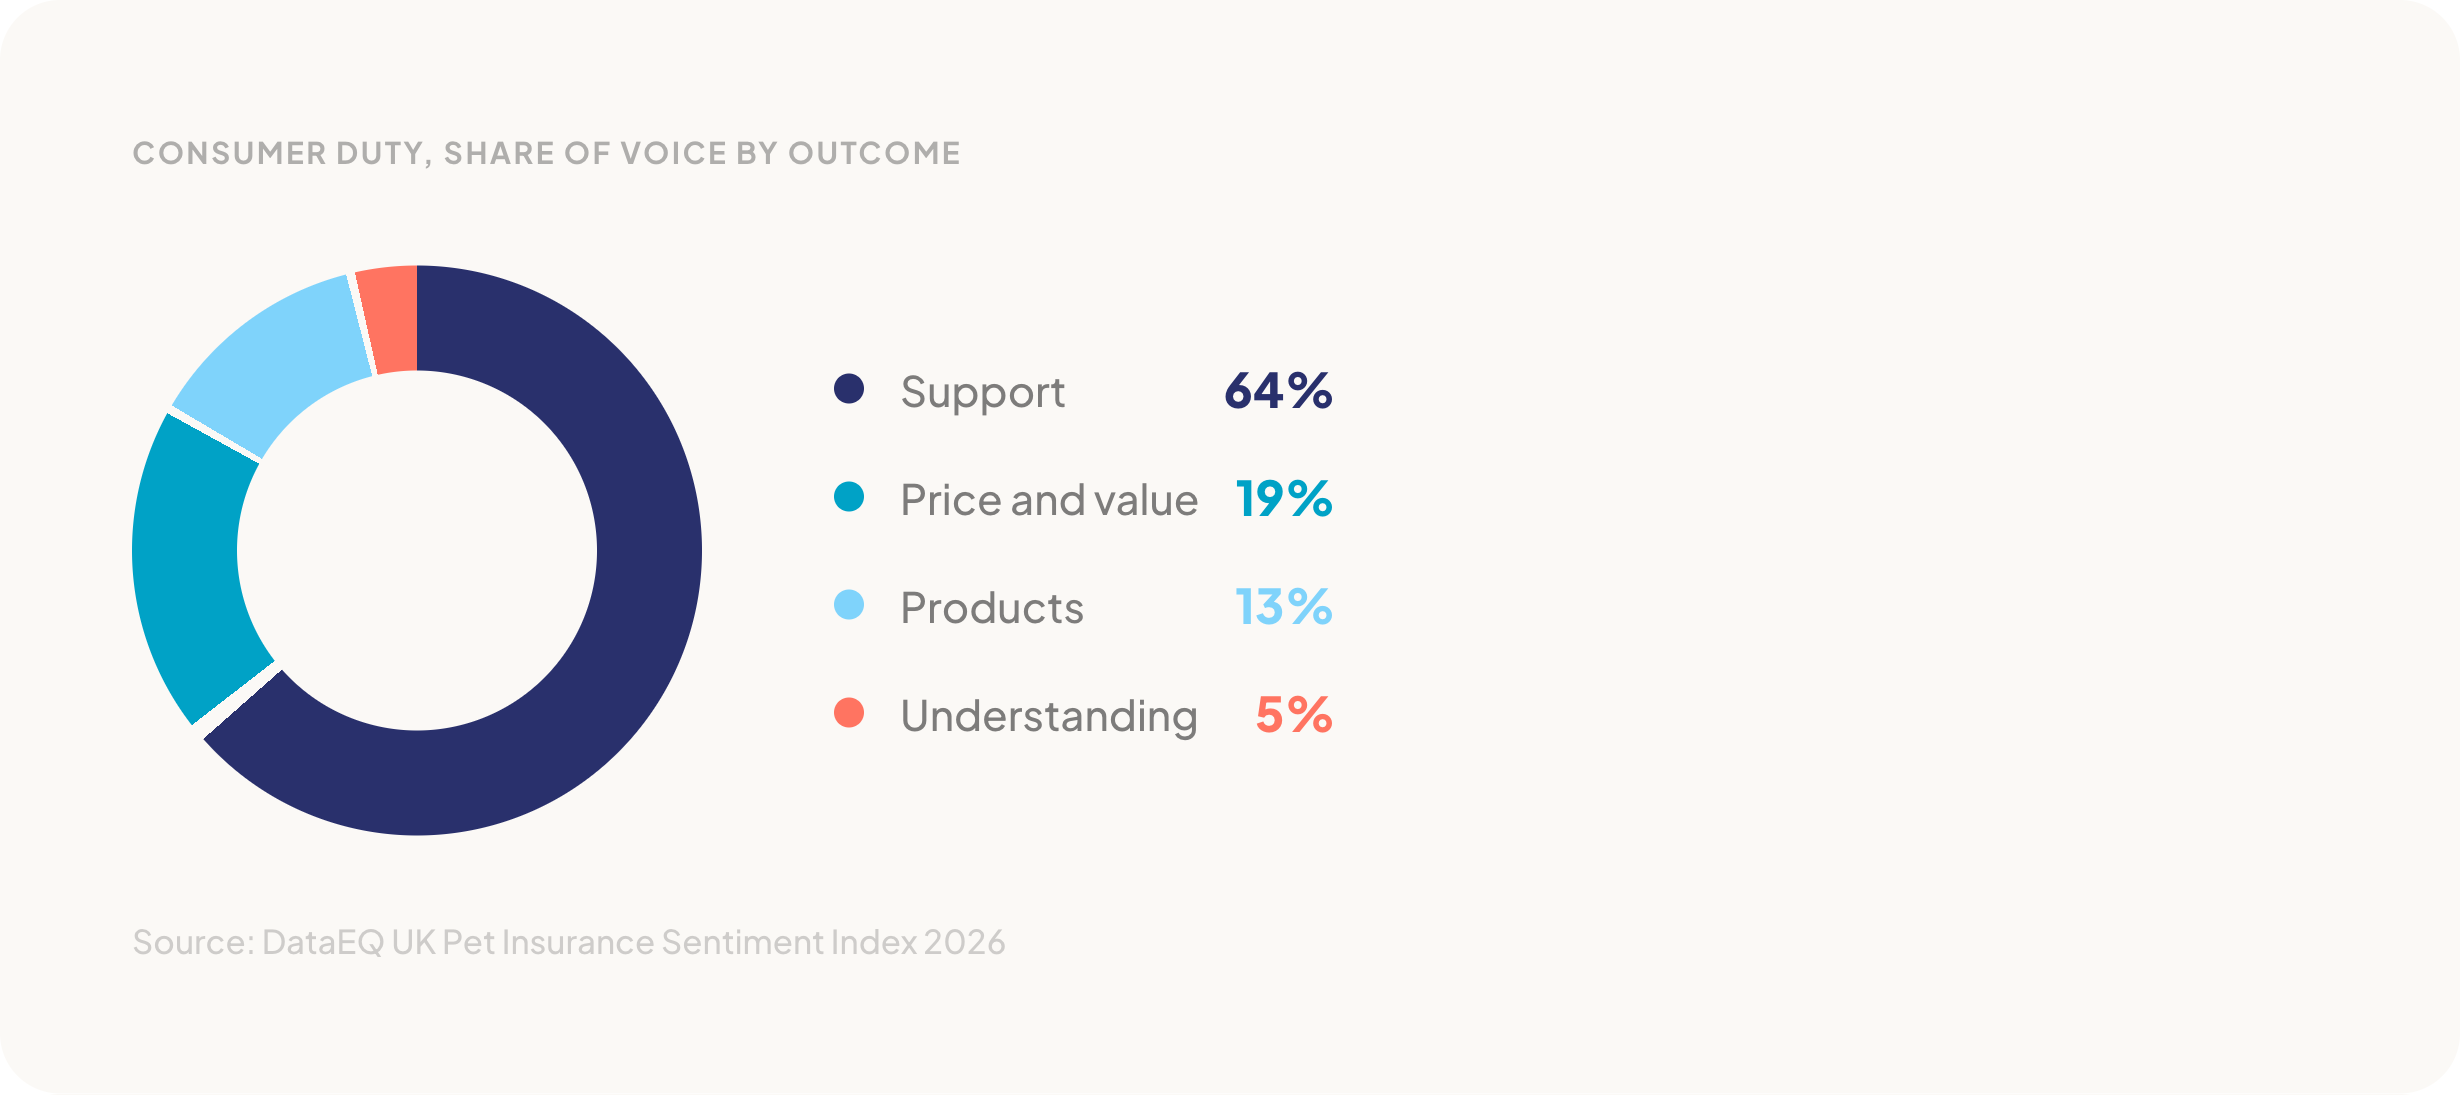
Consumer Duty, share of voice by outcome: Support 64%. Price and value 19%. Products 13%. Understanding 5%.
Consumer Duty, net sentiment by outcome: Support 57%. Products 24%. Price and value 7%. Understanding -20%.
Support, how customers are treated when things go wrong, accounts for nearly two thirds of all Consumer Duty conversation. Net sentiment breakdown reveals where outcomes are actually falling short.
And then Understanding. 5% of total volume, but scoring -20% net sentiment, the lowest of any outcome. Customers who mention understanding are overwhelmingly confused: unclear policy wording, surprise exclusions, terms they did not understand.
The FCA has been explicit that Consumer Understanding is one of the four outcomes at the heart of the Consumer Duty, and that firms are expected to equip customers with the information they need to make effective decisions. The burden of clarity sits with the firm, not the customer. When understanding-related conversation is both rare and overwhelmingly negative, the most likely explanation is not that customers are satisfied with their level of understanding. It is that they only surface it when something has already gone wrong.
How a customer reaches their insurer shapes the outcome they receive, but not in the way the headline numbers first suggest.
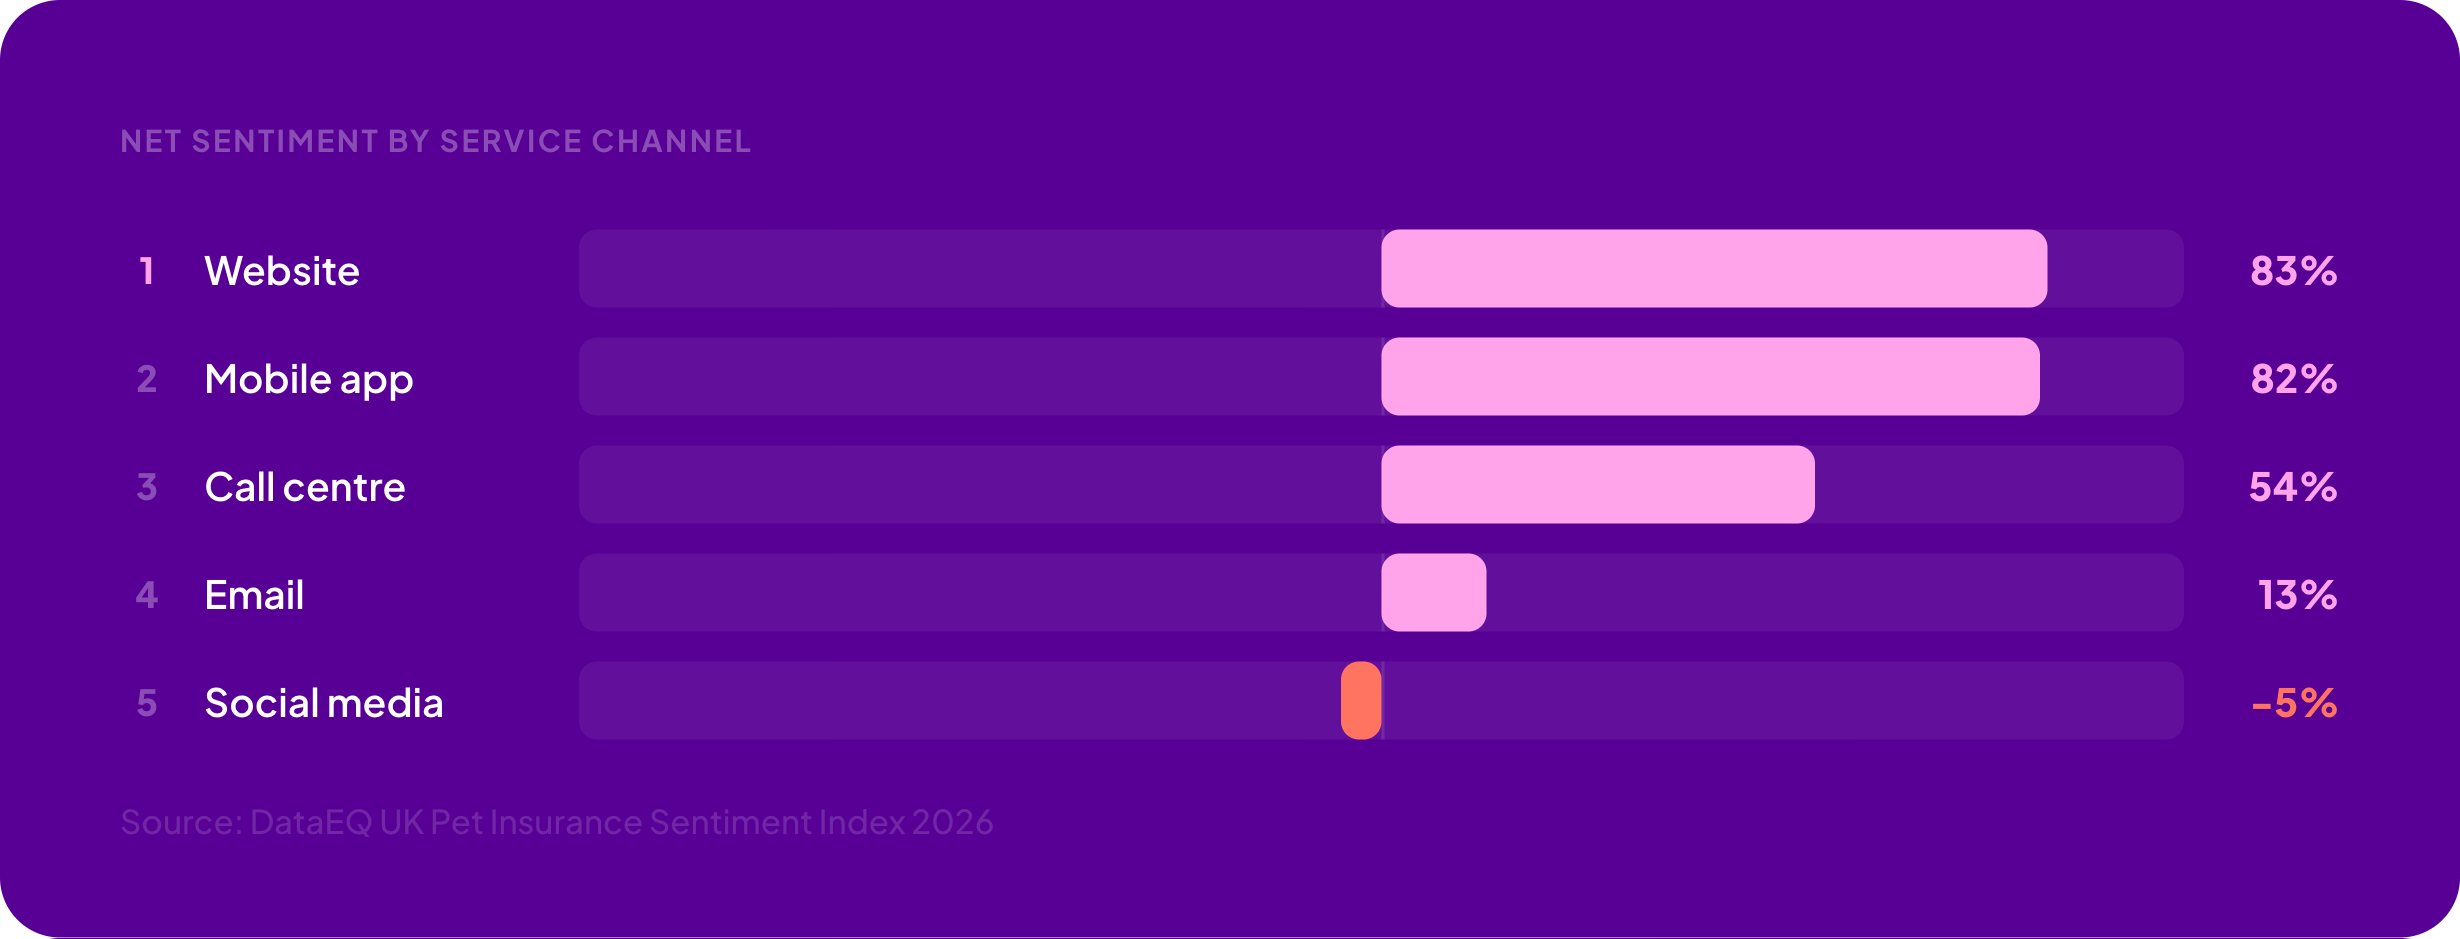
Net sentiment by service channel: Website 83%. Mobile app 82%. Call centre 54%. Email 13%. Social media -5%.
Digital self-service scores highest, which is unsurprising. The customers who finish a task on the website or app are the ones for whom the task was finishable. Call centres sit at 54%, the midpoint of the index, a reminder that for the majority of assisted interactions customers are walking away reasonably satisfied. Email drops to 13%, the channel where unresolved and asynchronous issues tend to pile up.
Social media at -5% is the number to pay attention to, not because it is representative of day-to-day service, but because it is the channel customers turn to when the others have run out. A customer posting publicly on X or a review platform has usually already tried the website, the app, the call centre, and email. By the time they surface in public, they are no longer asking for service. They are asking to be heard.
That is why the figures at the bottom of this list matter more than their volume suggests. They are not a measurement of channel performance. They are a measurement of what happens when every other channel has failed to resolve the issue the customer came in with.
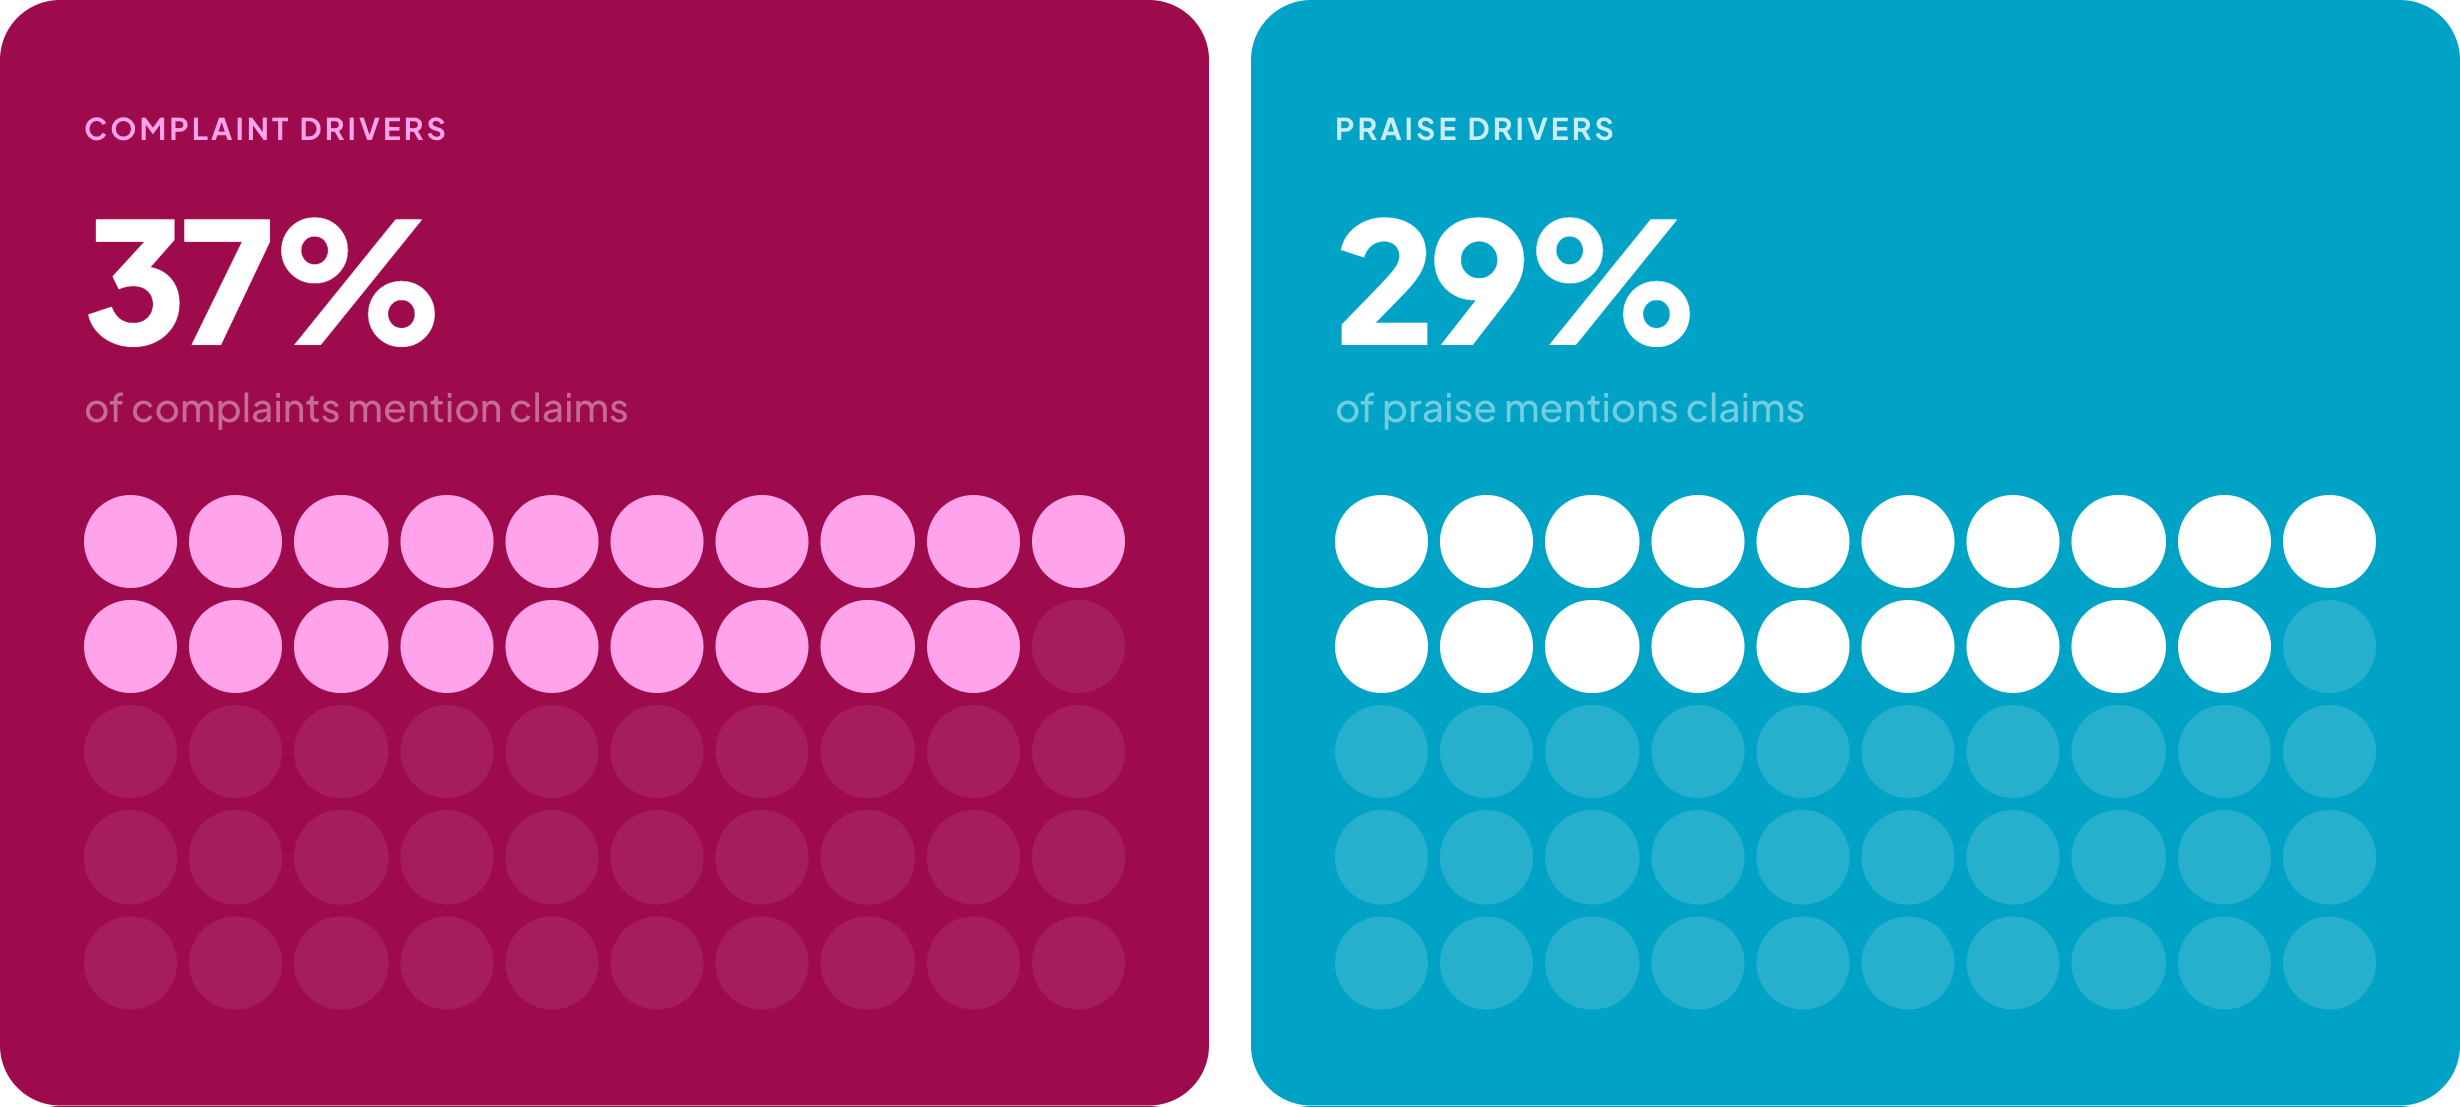
37% of complaints mention claims. 29% of praise does too.
No other touchpoint comes close. Claims is the single most polarising moment in the pet insurance customer journey.
When claims are handled well, quickly, clearly, with empathy, customers become advocates. But when claims go badly, the language escalates. Fast.
Once trust broke, complaints increasingly framed issues as fairness and governance failures. Operational complaints become accusations of unfairness. Service failures become governance failures. The language shifts from "you're slow" to "you're not treating me fairly" and once that shift happens, it rarely reverses.
Across 34,112 customer mentions, the DataEQ index surfaces a picture that is consistent, specific, and worth paying attention to.
The spread between the best and worst performers is wide and the gap is explained by fundamentals, not brand strength. Consumer Duty outcomes are unevenly delivered, with support overwhelmed and understanding almost invisible. Social media carries the most negative sentiment of any channel, because it is the channel customers reach when every other channel has failed them. The claims moment is decisive. And a significant layer of negative feedback sits outside the channels firms typically rely on.
None of this is invisible. It is all there in what customers are already saying. The question is whether it is being heard and whether it is being interpreted through the right lens.
The full DataEQ UK Pet Insurance Sentiment Index 2026 is available to download from DataEQ.
Download the report →